Through Caltech's summer undergraduate research fellowship (SURF) program, I spent the last summer studying the flare stars in CRTS data. Flare stars are a particularly interesting type of star because they are often younger, smaller, and cooler than the sun, but they produce enormous stellar flares that are much larger than solar flares. It is thought that the stellar flares are caused by the same mechanism that causes solar flares. This mechanism involves the magnetic fields around a star shifting until they align in such a way that the star's plasma is suddenly accelerated in a large plume or arc. You can imagine something like the solar flare seen in this image from NASA:

The stellar flares only last for a few minutes, but can increase the star's brightness by an order of magnitude! Below, I have some images from CRTS that captured a flare star while it was flaring:


In the image on the left the star is not flaring, whereas in the image on the right, the increase in magnitude implies the star is undergoing a stellar flare. These images are from the Catalina Real-Time Transient Survey database.
CRTS has tens of thousands of light curves just for flare stars alone. When you add that to the other thousands of objects it has observed it becomes difficult to classify the light curves by hand. The goal of my project was to come up with an efficient way of sorting out the flare star light curves from the non-flare star light curves. Later, we wanted to examine the flare star light curves to define common characteristics of flare stars and look for correlations with spectral type to help classify flare stars for future synoptic surveys. If we could do that then we would understand the nature of flare stars better and other surveys could be more efficient in their searches. If the surveys were interested in flare stars then they would know what to look for, and if they were interested in a different phenomenon then they could stop spending time on objects that were likely to be flare stars.
The sort of light curves we were dealing with looked like this:
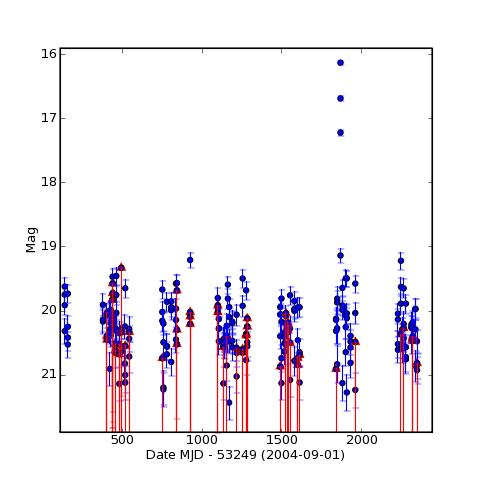
If you don't have an astronomy background, the way light curves work is time is on the x-axis, as measured by the Modified Julian date (MJD is just a calendar astronomers use, it counts the days since a particular time) and magnitude is on the y-axis. The magnitude axis looks like it is upside down, but the way magnitude is measured means that a larger number indicates a dimmer star. So brighter stars go closer to the top of the plot. In this plot, there is only one star and each point is a different observation of that star. We can see that there are three points that are much higher than all the rest. These are from the observations that were made when the star was flaring. The flares are typically a few minutes long, so we would expect to see the flaring observations all stacked on top of each other, plotted on the same night. This light curve is also from the Catalina Real-Time Transient Survey database.
Light curves from other objects would look different. For example, a supernova would get bright very quickly and then slowly decay over the course of a few days, depending on the type of supernova. We wouldn't expect to see such a drastic decrease in magnitude in a supernova light curve. Since different transient objects produce different patterns in their light curves, we can exploit this to write a program to notice these differences and classify the light curves.
One requirement we might pick for the program to classify the light curve as a flare star is that the light curves shows at least one point that is significantly higher in magnitude than the average magnitude. We can set a value for what qualifies as "significantly higher" but this may need to be changed later if we find out that many flare stars produce short flares, flares with smaller amplitudes than expected, and we have been discarding them since they didn't meet our requirement. We may also need to change this value if it is too small and we have been acquiring many false positives. To figure out if we need to change this value, we can test the program on light curves that have already been classified and see if it is giving reasonable results. But even if the program is doing well, we still may need to change it if new science comes in about the short flares that I previously mentioned.
We should also probably specify how many of these observations should have high magnitudes. We don't want too much of the light curve to be high. I ended up putting the limit at 10% of the observations. We also don't want too few of the points to be high, because then the program may classify a light curve based on an outlier. So let's specify that there have to be at least four observations on any given night and at least three of the four observations need to be above the average magnitude by at least the value that we picked earlier.
Flare stars are also not periodic. This means that if we spot multiple observations that are high enough to qualify as flares, but on different nights, the light curve we are looking at probably does not belong to a flare star. If the high magnitude observations were spread out over multiple nights, the likelihood that the object in question is something like a supernova increases.
Once we can code all these criteria in to a program, we can run the program on the light curves that have not been classified. If the program finds a light curve that meets all the specified requirements, it will write the name of the object associated with the light curve in a list and label it a flare star. Otherwise the object is labeled as a non-flare star. How to classify those remaining objects is up to the next person to work on this project.
After we get a list of our objects with the classifications back, we should check if the results are reasonable. We can do this by plotting some the light curves that were classified as flare stars. If there is some reason why the program classified light curves as flare stars when they obviously do not meet the criteria, there may be something wrong with the code or our assumptions about what qualifies as a flare star. If there is no consistent reason why light curves were incorrectly classified, we can look in the Sloan Digital Sky Survey database to see if there are any optical artifacts or nearby stars that may be interfering with the observations. Finally, we can also check the spectra associated with the object to see if it matches that of a typical young, red flare star. Or we could get our own spectra for interesting candidates! But that's a story for another day.
Once we check the accuracy of the program, and it is doing well, we can start extracting data from the light curves that will help us classify flare stars for CRTS and other surveys. Unfortunately, I ran out of time before I could get to that part of the project. So if anybody is interested in working on something like that, you should talk to Professor Djorgovski. He was a really good mentor to work with over the summer. Good luck!
I'm glad you had a good time with your SURF, Joanna. It sounds like you really got a lot done! The work you were doing sounds pretty fun, too.
ReplyDeleteQuestion (possibly related to what we've done in the class): In the plot of the lightcurve, why does the data come in bunches with big gaps in between? How often do those gaps occur?