Saturday, November 19, 2011

Stellar Formation

Ay 20 – The Formation of Stars
Problem 5
Primary author:  Joanna Robaszewski
Secondary authors:  Cassi Lochhaas and Daniel Lo

Abstract

This problem investigates the initial mass function that regulates mass distribution in star forming regions.  It looks at the number of stars that fall into certain mass ranges and how much each mass group contributes to the overall luminosity and color of the star forming region.


Introduction

The initial mass function describes the distribution of stellar mass at the birth of the star.  It takes on the form:


N is the number of stars that are forming, M is the mass, and A is a proportionality constant to be determined in the problem.  We will be dividing the stars into three groups based on mass.  One will be the low mass stars with a mass range of 0.1M⊙ to 1M⊙.  Another will be the intermediate mass group with a range of 1M⊙ to 8M⊙.  The last group will contain the high mass stars which fit into the 8M⊙ and greater range.  M⊙ is one solar mass and is equal to  2 * 1033 grams.  Luminosity is a measure of a star’s power output.  The sun has a luminosity of 4 * 1033 ergs/s.


Questions and Results

5.a  Consider a newly formed globular cluster with total mass of 106 M⊙ and the initial mass function in the mass range 0.1M⊙ to 20M⊙.  Find the proportionality constant A.

We can think of dN/dM as being somewhat similar to a probability density.  From it, we can determine how likely it is that a star forming in this cluster will have a certain mass.  To find the total number of stars in some mass range we use the integral:


To find the total mass of all the stars forming for some mass range, we use the following integral:


In this case we know the total mass of the cluster is 106M⊙ and the mass range is 0.1 M⊙ to 20 M⊙.  So let’s set up the integral:


So we found the proportionality constant A.  If anybody has any ideas as to what the units mean, I’d be happy to hear them.


5.b  What is the fractional number of stars that are fit in the high mass category, the intermediate mass category, and the low mass category (where the categories are defined in the introduction)?  How much mass is contained in each of these mass bins?

We can use the integrals we found in the first part to find the number and mass of the stars in the various mass bins.  All we have to do is pick appropriate boundaries for the mass.

For the high-mass category:


For the intermediate-mass stars:


For the low-mass stars:


So in total we have 3.08 * 1016 stars in the cluster.  0.19% of these stars are in the high-mass range.  The intermediate-mass range contains 4.2% of the stars in the cluster.  And the low-mass category has 95.5% of the stars in the cluster.  The total mass in the high-mass bin is 1.41*1048 grams.  The total mass of all the stars in the intermediate-mass range is 5.49*1048 grams.  The total mass found in the low-mass range is 1.31*1049 grams.


5.c  The luminosity of a star scales with mass differently for different mass ranges.  The scaling relationships are below:

Low-Mass Stars:  L = M5
Intermediate-Mass Stars:  L = M3
High-Mass Stars:  L = 64M

What is the total luminosity of the cluster?  What are the fractional contributions to the total luminosity from each mass range?

First, let’s calculate the luminosity from the low-mass stars.  We can use the same integrals we used to find total mass, but we have to make some substitutions.  An integral for total luminosity would look like this:


So for the low-mass stars:


We also want to convert the boundaries from 0.1 M⊙ and 1 M⊙ to (0.1 M⊙)5 and (1 M⊙)5.

The total luminosity for low-mass stars is:


For those of you paying attention, you’ll notice that the units aren’t correct for luminosity.  Ok, so I lied a bit when I said we were calculating the total luminosity contributed by the low-mass stars.  What we actually have is proportionally how much the low-mass stars will contribute to the overall luminosity of the cluster.  Once we calculate the luminosity contributions from the other mass ranges we can find the total contributions toward the cluster’s luminosity.  After that we can find the actual percentages that each mass category contributes to the total luminosity.  So we don’t need to calculate the actual luminosity.  We can just find the proportions based on how luminosity scales with mass for various ranges of mass.

Now we need to calculate the luminosity contribution from the intermediate-mass stars.  The new integral boundaries are now 1M⊙ and 8M⊙. 
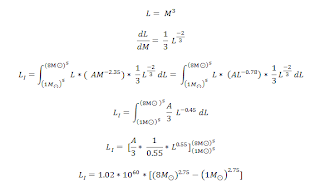
Now to calculate the luminosity contribution from the high-mass stars with integral boundaries 8M⊙ and 20M⊙:


Unfortunately these numbers are very far from those that we calculated during class, but I’ve already spent a week and a half trying to get the calculations to work out so I’m just posting what I have.  Please let me know what I’ve left out in my calculations if you figure it out.  In class, my group did the calculations and found a very interesting result.  Even though the stars in the high-mass category were extraordinarily few in number in comparison to other types of stars, they contributed about 55% of the luminosity.  The intermediate-mass stars contributed about 45%, while the low-mass stars contributed less than 1% of the luminosity.  We were all quite surprised and intrigued by this result.

5.d  Would you expect and active star forming galaxy to look more blue or more red?  What about a very old, inactive, elliptical galaxy?

As was stated in the previous section, the high-mass stars contribute the most to the luminosity of the cluster, despite hardly contributing to the number of total stars.  The larger stars that form are blue, while the smaller stars are red.  So since the largest stars are contributing the most to the luminosity of star-forming region, an active star forming galaxy would look blue.  The largest stars are also the ones the die off first, leaving behind the smaller, red stars.  So in an old, inactive galaxy, all the large blue stars are gone.  This leaves the small red stars to contribute most to the luminosity of the galaxy, thereby making it look red.

Wednesday, November 16, 2011

What is a Professional Astronomer? - Part II

A little while ago, I wrote down what my thoughts were on what it means to be a professional astronomer prior to researching the topic.  My partner in this investigation is Cassi Lochhaas.  She and I sat down with Kunal Mooley, a third year grad student in astrophysics at the California Institute of Technology, to interview him about his experiences and thoughts related to becoming a professional astronomer.  Our questions and Kunal's answers can be found at Cassi's blog, Life and Its Relation to Astronomy (or Vice Versa).  While you're reading that, Cassi and I will continue our research on what it means to be a professional astronomer.

Sunday, November 6, 2011

What is a Professional Astronomer? - Part I

One of the goals my astrophysics professor has for our class is for us to come away with an understanding of what it means to be a professional astronomer.  But before doing any research or interviews on the subject, we are supposed to record our own assumptions and impressions on what it is professional astronomers do and how somebody gets to be a professional astronomer in the first place.  So here is "What is a Professional Astronomer? - Part I"  More parts will follow after I have been hit with a dose of professional astronomer reality.

Ever since I was 12 or so, I believed I wanted to be a physicist.  Eventually it dawned on me that I had no idea what a physicist did.  I've slowly built up an idea since then, but beyond knowing that there are two sorts of physicists, theoretical and experimental, I still don't know what these physicists actually do from day to day.  I know that astrophysics is not the same as physics, but I still think this assignment will be tremendously helpful for me to figure out the general evolution of a professional scientist's career.

Let's start with how you become a professional astronomer.  I assume that at some point before or during your undergraduate studies, you somehow become interested in astronomy.  This could be through pictures, lectures, natural curiosity, whatever.  Something about astronomy just sticks with you.  Then comes an undergraduate program in astronomy, astrophysics, or physics.  This involves taking the courses that your school deems necessary to be an astronomer.  Perhaps you will do some astronomy research during the summer or get the chance to use a telescope.  Eventually you'll graduate from the undergrad program, and most likely move on the graduate school in astronomy, although physics may still be acceptable at this point depending on what kind of physics you specialize in.

In grad school you'll pick an adviser and start specializing.  I suppose astronomy may also be split between experiment and theory.  If you do theory, you'll probably be doing lots of computer simulations and math to make predictions.  If you do experiment, you'll probably be doing lots of observing and data analysis to test those predictions.  You may also have to specialize in a type of instrumentation and wavelength, for example spectral, optical, x-ray imaging, and so on.  In either case, you will have to narrow your focus to one or a few closely related astronomical phenomena.  This does not mean that you have to stop studying everything else, but you'll start to become a specialist in one area, such as star formation or extra solar planets or black holes.  As an astronomy grad student, you'll probably go to many, many conferences and observing sessions in less enchanting places, like Arizona, while your adviser goes to all of the observing runs in Hawaii.  After 4 or 5 or 6 or 7 or 8 years you'll probably defend your thesis and get your Ph. D.  Then you'll get to be a postdoc somewhere!

I actually have no idea what postdocs are.  I think they sort of float in limbo between being a grad student and being an assistant professor.  They probably continue their grad research, or maybe start to branch off in a slightly different direction.  The have probably switched advisers, but now have to do some research on their own.  I'm not sure what astronomy grad students do after they have finished grad school if they do not go into academia and become postdocs.  Guess I'll find out later!

Continuing down the academia sequence, after you're done with your postdocs, you'll probably be an assistant prof somewhere.  I'm not actually sure what makes an assistant prof an assistant.  I guess you may be allowed to lecture occasionally and you still have to do you own research and you don't have tenure yet.  That's pretty much all I have for the life of an assistant professor.

Eventually you'll be an astronomy professor!  You'll have classes to teach, your own group of grad students to manage, and you'll be the one going to observe in Hawaii.  You'll also have to write lots and lots of grant proposals.  You'll continue to gather data and publish papers until you're either disproved by another group of astronomers or your ideas become widely accepted.  In the latter case there will be much cake and celebration, hooray!

If you do not become a professor, you may still spend your time doing research and writing grant proposals at labs or observatories.  You may spend your time as the director of a telescope.  Maybe you'll design planetarium exhibits.  As I said before, I don't really know what astronomers do outside of academia.

I suppose the ultimate goal of an astronomer is the same as the ultimate goal of any scientist, just applied to the field of astronomy.  This may include deepening the understanding of the phenomena that make up the universe, and simply investigating questions that are interesting to them.  Astronomers have to be well-organized and hard-working, but also creative and able to look for solutions in brand new ways, just like any scientist.  I also think that astronomy is a highly collaborative field.  I find the projects that publicly publish information directly after discovery, like the Catalina Real-Time Transient Sky Survey and projects that encourage at-home interaction, like Galaxy Zoo, to be an interesting new way of doing science, and I wonder if other fields have projects like these as well.

Well, those are my initial assumptions of what it would be like to be a professional astronomer and what it takes to get to that position.  Most of my hypothesis comes from knowledge gained from PhD comics: http://www.phdcomics.com/comics.php.  Stay tuned as I gather data on what it actually takes to be a professional astronomer!

Friday, November 4, 2011

The Cosmos According to Linux

Sorry I've been running slightly behind in writing.  It's been midterms week, so I've been taking tests for a while.  I'll try to catch up on posts this weekend.

I have a Windows/Linux dual-partition for my computer and every time I log-in to the Linux partition I am greeted by one of nine or so majestic astronomy pictures.  The "Cosmos" desktop background is a slide show of various astronomical phenomena and it periodically changes from image to image while you work.  I've had this background for a few years now, but I only recently wondered about the identities of the objects I was looking at.  Some are easy to identify, such as Earth and Jupiter, but some were a mystery.  I looked into the details of a few of the images.  For some I could only find what type of object it was and not the name of the object, but the information that I found on the others I will share below.  All the images are from http://hqwalls.blogspot.com/2010/07/cosmos-wallpapers-2560x1600.html.  The majority of the information was gathered from http://www.spacetelescope.org/, http://www.universetoday.com/, and http://apod.nasa.gov/apod/.

Image 1:  The Helix Nebula


The Helix Nebula is a planetary nebula approximately 700 light-years away, making it one of the closest planetary nebulae to Earth.  The star at the center of the nebula is very old (and by "very old" I mean older than the sun and already past the red giant stage), and has already blown away its original outer-most gas and dust.  Eventually, the star will become a white dwarf and the gas we can see now will have also been blown away.  The structure of the Helix Nebula is interesting because there are "knots" in the shells of gas and dust.  These knots are dense, intense patches of glowing gas.  They have comet-like tails that point away from the star at the center of the nebula.  Knots of nebulosity were first discovered in the Helix Nebula and have been found in other nebulae since then.  The Helix Nebula got its name because the angle from which we view the nebula makes it look as if we are looking down the center of a helix.


Image 2:  The Sombrero Galaxy


The Sombrero Galaxy is an unbarred spiral galaxy about 29 million light-years away from Earth.  It has an unusually large central bulge and an extraordinarily well-defined dust lane.  These characteristics, along with the fact that we view it edge on, make it look a bit like a sombrero.  The ring contains mostly hydrogen gas and dust, and most of the stellar formation within the Sombrero Galaxy happens there.  The Sombrero Galaxy also has one of the highest instances of globular clusters and one of the most massive black holes at its center.  The black hole is estimated to have a mass of at least one billion solar masses.  The galaxy cannot be seen with the naked eye, but it can be observed using only a 4-inch telescope.


Image 3:  NGC 3370


NGC 3370 is also known as the Silverado Galaxy.  It is a spiral galaxy about 98 million light-years away from Earth.  It has well-defined spirals without a prominent central bulge.  Both Cepheid stars, which vary in brightness in a predictable, periodic way, and type Ia supernovae have been found in this galaxy.  Since Cepheids and type Ia supernovae have very distinctive light curves, they can be used to calculate the distance to the object they are found in.  The age of the universe can then be estimated based on the distances to galaxies.  This is possible because of the expansion of the universe.  The farther away a galaxy is, the longer it has had to move away from our point of observation, and so the older it is.  Once we know how distance and age correlate, we can convert distance to age, and the farthest galaxies can give us clues about how old the oldest objects in the universe are, thereby putting a lower bound on the age of the universe itself.  Due to the presence of the Cepheid stars and type Ia supernovae, the distance to NGC 3370 could be measured quite accurately.  So NGC 3370 would be a good galaxy to use in a study that was trying to find the relationship between distance and age, and in fact was used in such a study in 1994.  You can also see many background galaxies in this image.


Image 4:  The Whirlpool Galaxy


The Whirlpool Galaxy is a spiral galaxy about 23 million light-years away from Earth.  We observe it almost directly face on, which gives us a magnificent view of its spiral structure.  The smaller galaxy on the right side of the image is NGC 5195.  The Whirlpool Galaxy is gravitationally interacting with NGC 5195, giving astronomers a chance to study galaxy interactions.  The pink spots along the spiral arms are star-forming regions.  The blue spots are star clusters.  The other material in the arms is mostly dust and hydrogen gas.  NGC 5195 is believed to help increase the number of star-forming regions.  As NGC 5195 passes behind the Whirlpool Galaxy, NGC 5195's gravity ripples and compresses the gas in the spirals of the Whirlpool Galaxy.  Once the gas is compressed enough, it starts to collapse under its own gravity and star-forming regions begin to form.

The only problem with knowing the identities and some of properties of the objects from the Linux Cosmos wallpaper is now every time somebody is near me and I'm working with Linux, he has to hear all about the image on my desktop.  And 30 minutes later it changes to a new slide, and he has to listen to a new explanation all over again.  On the other hand, I'm not so sure that a short, spontaneous astronomy lesson should be considered a problem.  Either way, it's nice to be able see one of the images and no longer have to think "Oh, that's pretty, but what is it?"  Now I know.

Wednesday, October 26, 2011

Estimating Solar Luminosity

Ay 20 – Stellar Properties From Afar
Problem 2
Primary author:  Joanna Robaszewski
Secondary author:  Cassi Lochhaas


Abstract

This problem attempts to estimate the luminosity of the sun based on the temperature of a light bulb.


Introduction

Luminosity is a measure of how much energy a star emits per time.  It is a conserved quantity and does not depend on how far away the observer is from a particular star.


Questions and Results

We had a 100 watt light bulb with efficiency:


Remembering that there are about 1*107 ergs/s for every watt, we can convert our light bulb power output to cgs units. 100 watts = 1*109 ergs/s.  Our skin is a good thermometer so as we move our hand closer to the light bulb, we should be able to tell when it feels as if we are sitting in direct sunlight.  For me, this distance was about 4 centimeters.  We can then set up a proportionality of power over surface area, keeping in mind that luminosity is equivalent to power, and the distance between the sun and the Earth is 1 AU = 1.5 * 1013 cm:


The official value for the luminosity of the sun, as given by Wolfram Alpha, is 3.8 * 1033 ergs/s.  So our value has a percent error of 63%, but at least it is the correct order of magnitude.

Wednesday, October 19, 2011

Observing at Palomar

Since I was too sick to go on the Palomar field trip with the Ay 20 class, I thought I would write about the time I got to observe at Palomar.  Hopefully this will help make up for my lack of Palomar related activities in the past week.

In the summer of 2011, I was working on an astrophysics project at Caltech dealing mostly with flare stars.  (I wrote more about this in one of my earlier posts.)  Near the end of the project, the astrophysics department sent out a notice that they would be accepting proposals from undergraduates to observe at Palomar, provided the data the the undergrads wanted to obtain would be used for some sort of classification or characterization.  Well I was working on characterizing flare stars, and my co-mentor and I realized we could use some spectra to help confirm the nature of some of our flare star targets.  My co-mentor helped me develop a list of targets and told me how finding charts worked, and then I sent in my proposal.  A couple days later, I got an email from the person in charge of organizing the whole thing saying my proposal had been accepted!  I was really excited, since the only telescope I had ever used had been a 6 inch refracting telescope.  It was a decent enough telescope to track asteroids, but now I was going to go to Palomar and use the double spectrograph on the 200 inch Hale telescope!  I was also excited because I had spent the summer of 2010 extracting spectra from images a grad student had taken at Palomar, so now I was getting a chance to see how those images had been obtained.  I was also rather nervous.  What if I messed up the equipment?  Or what if my co-mentor and I had miscalculated and my targets weren't actually visible?  I only had a couple hours with the telescope and I didn't want to waste them.   I guess this is a common worry among astronomers.

I drove up to Palomar with a few other undergraduates and a couple grad students who were there to make sure we didn't screw anything up too badly.  We dropped our stuff off at the residential building.  The observers at Palomar stay in this house called the Monastery.  It is run by a couple who make the place feel very cozy.  There are refrigerators filled with food and a living room full of games and hard candy.  The bedrooms are small, but large enough to have a bed and a desk.  There is usually a Jack-and-Jill style bathroom between every two bedrooms.  I got a thrill thinking of all the famous astrophysicists who might have slept in the same bed I was sleeping in, eaten at the same table I was eating.  The best part of staying at the Monastery was dinner.  The woman who helped run the house was a magnificent cook.  All the hidden astronomers would come out of their rooms and gather around the table around 6:00 pm.  Then we'd all eat and introduce ourselves. After learning somebody's name, the first question everybody asked was "physics or astronomy?"  I'm not sure why this amused me, but it did.  The conversation would almost always then move on to the newest observing techniques for various wavelengths and stay there for the rest of dinner.

Everyday before dinner, we would have to go up to the telescope to calibrate it.  There were two instruments we would could use:  the double spectrograph and the large format camera.  We would have to calibrate whatever instrument we would be using later that night.  We also had to calibrate for different settings, like if we were changing the binning.  If we had time before dinner, we would also start taking flats, biases, and lamp exposures.  These are images of the blank dome, images of zero second exposure time, and images of arc lamps for later wavelength calibration, respectively.  Astronomers use these images to reduce noise and provide a reference for wavelengths for spectra.  If we didn't have time, taking these images would be the first thing we would do after we got back from dinner.

After dinner, it would be time to get right back to telescope to start observing.  One of the things that made observing a little less scary was the idea of "night lunch."  The woman that helped run the Monastery would pack you whatever you wanted in a brown paper bag, provided you filled out the night lunch form in time.  Then she'd put our names on all the bags and we'd carry our night lunches up with us to the telescope.  Just the name "night lunch" made me feel better.  Another aspect of observing that made me less worried about ruining the telescope was the people working with us at Palomar.  They would stay up with us the whole night, helping test the telescope at the beginning and making sure the computers never went down until the sun came up.  Somebody else was in charge of putting in our coordinates and slewing the telescope to our target.  All these people were really easy-going and helpful.  And they knew how to do their jobs very well.  If the person in charge of slewing wasn't sure if she was on target, she knew exactly which guide stars to use to figure out how the telescope was positioned.  They were also good company throughout the night.  Finally, the interface also made me fairly reassured that I wasn't going to break the telescope.  I was rather surprised when I first saw it, because it reminded me of the interfaces I had used in my sophomore physics laboratory classes.  The interface for the double spectrograph was color-coded for the red side and the blue side and there were big buttons at the bottom saying "Go Expose."  All you had to do was enter in the exposure time and how many images you wanted and after the person slewing the telescope told you everything was in place, you just had to press the "Go Expose" buttons and wait for the images to expose.  The most difficult part was remembering to change the file name before you saved an image.

Most of the night I was just sitting in the data room working on my research progress reports and waiting for my targets to come up.  Then I'd spend a couple hours pressing "Go Expose" and waiting for my images to develop and the telescope to slew.  Then I'd leave the controls to somebody else and go back to my progress reports.  Once those of us not observing got bored of waiting and we had extracted all the entertainment we could out of eating our night lunches, we decided to explore the observatory.  We weren't allowed to open the door to the dome when an exposure was being taken, but we got to slip out in between exposures.  And it was awe-inspiring.  The dome the houses the Hale telescope is huge.  It's hard to imagine unless you've been inside it.  The telescope is also enormous.  We had a lot of fun standing on the edge of the room and rotating with the dome when a different part of the sky needed to be exposed.  Then we decided to climb up to the outdoor catwalk surrounding the dome.

The sky was incredible when we stepped outside.  It was so clear.  We could see traces of the Milky Way and the occasional meteor.  Off to the east, I believe, there was a small glow from a nearby forest fire.  Luckily, the smoke wasn't blowing toward us, or our observations could have been interrupted.  It was quite peaceful, although somewhat surreal, to hear only the sound of crickets and the slewing of the telescope.  After staring off into the horizon for a while, I finally asked if the catwalk rotated along with the dome.  As if on cue, the trees and hills in the distance started moving.  Being on the catwalk while it rotated gave us a nice 360 degree view of the surrounding area and then we headed back inside to warm up.

It was finally 5:30 am when we had taken enough morning flats to satisfy the grad student who was observing with us and he gave us permission to go back to the Monastery and go to bed.  Since the sun was not all of the way up yet, as I walked back down the hill from the observatory I convinced myself that it was actually sunset, not sunrise, and I was about to sleep through the night.  I walked into my room and lowered the astronomer black-out shades.  These are by far the coolest window coverings I have seen.  They were a little worn, but they still worked splendidly and blocked out so much light that I was able to continue to delude myself that it was, in fact, not daytime, but nighttime, and therefore entirely appropriate to sleep.  In the early afternoon, it was not the sun that woke me, but birds chirping.  And so the cycle of calibrations, dinner, observing, and sleep started again.

Every once in a while, we would have some free time and get to explore the observatory.  We got to climb up into the cage where the double spectrograph CCD is held and look around.  We also got to take a ride up to the primary focus.  All the light coming from a target is goes through the primary focus, and back when astronomers used photographic plates, they used to sit up there all night long.  There is a ton of equipment in the center of the primary focus cage and then an itty-bitty uncomfortable-looking wooden chair smashed in on the side, in which people like Hubble would have to stay and manage the plates and the telescope.  It was also so cold up there on winter nights that the astronomers had to wear a special outfit that could pump warm water throughout the cloth and around the person.  We also discovered the billiard room.  On nights when it the conditions were too poor to observe, the astronomers would spend their time in the billiard room until the sky cleared up.  We played a couple games while waiting for some of the flats to be taken.  The room still looks like it's from the 1960s or 1970s (not that I would know, since I was born in the 1990s, but stereotypically speaking) with bright orange and brown wall patterns and floors.

After two nights of observing and 9 out of 10 targets (the last one had been too close to the moon and was imaged later when there was a little extra time), I headed down Mount Palomar back to Caltech with the other undergraduate students.  As the conversation in the car turned back to observation techniques and adaptive optics, I daydreamed about the weight I had felt on my finger as I flipped the switch to open the mirror cover on the largest telescope I had ever, and probably will ever, use.  I may not end up being an astronomer and spend my life observing, but I doubt I will ever forget that feeling.  I am very much grateful to the Caltech astrophysics department, as well as to Palomar, for giving me the chance to experience it in the first place.

The Astronomical Unit

Ay 20 – Lab 2:  The Distance from the Earth to the Sun
By:  Joanna Robaszewski

Purpose of Experiment:  Using images of the transit of Mercury across the sun from the Transition Region and Coronal Explorer (TRACE) and some prior knowledge of the solar system, determine the value of the Astronomical Unit, the distance from the Earth to the Sun, in centimeters.  Additionally, find values for the semi-major axis of Mercury’s orbit, the mass of the sun, and the mass of Earth.


Procedure:  We were given the following image of the transit of Mercury across the sun:


The image is from:  http://trace.lmsal.com/POD/images/Mercury2003_combo.gif

We were also given the following information:

  •     The angular width of the sun as see from Earth is 0.5 degrees.
  •         The period of Mercury is PM = 87 days
  •     The period of Earth is P⊕ = 365 days.
  •        TRACE is in a polar orbit around Earth
  •        Kepler’s third law is P2 = (4*pi2 *a2) / G (M1 + M2), where a is the semi-major axis of a planet’s orbit.
We know the radius of the Earth from our previous lab, though we can use a more accurate value than the one we calculated.

Looking at the solar system from a side view we get the following set-up:


Where delta_a is the distance between Earth and Mercury.
We know that the oscillations seen in the image of Mercury’s transit are caused by the change of position of TRACE.

Using Kepler’s third law we can get a ratio of Mercury’s period and semi-major axis to Earth’s period and semi-major axis:


We can substitute a⊕ - delta_a for aM which gives us:


We know the periods of Mercury and Earth and we want a⊕ so all we need to find is Δa.  To find Δa we needed to find theta.

We did this by estimating the amplitude of the wave seen in the transit image and then finding how many of these amplitudes could fit into the diameter of the sun.  We had to finish drawing the circular cross-section of the sun and then divided the diameter into segments that were as long as the amplitude.  We found approximately 50 amplitude-long segments fit into the diameter.  Since the sun has an angular width of 0.5 degrees we could find the angular width of the amplitude of the transit and that would be equal to theta.


From the diagram depicting the partial solar system from the side we know:


Theta is small enough that we can apply the small angle approximation:


We can now put this into the ratio from Kepler’s third law:


We can now find aM:


Using Kepler’s third law we can find the mass of the sun:


We can neglect the mass of Mercury because it is so small in comparison to the sun.


Now we can find the mass of the Earth by using Kepler’s third law and the mass of the sun:


Inserting values and evaluating gives the result:


Error Analysis and Results

We want to compare our calculated values for the semi-major axes of Earth and Mercury and the mass of the Earth and the sun with accepted values.

We found the semi-major axis of Earth, and therefore the Astronomical Unit, to be


Using NASA’s planetary facts sheet, available at http://nssdc.gsfc.nasa.gov/planetary/factsheet/, the accepted value for the AU is 1.5 * 1013 cm.  So our percentage error for the AU is:


We found Mercury’s semi-major axis to be:


The accepted value is 5.8 * 1012 cm.  The percentage error for Mercury’s semi-major axis is:


We found the mass of the sun to be 5*1031 g.  The accepted value is 2*1033 g.
Our percent error for the mass of the sun is:


We found the mass of the Earth to be 9.5 * 1031 g.  The accepted value is 6 *1027 g. Our percent error for the mass of the Earth is:


The values we found for the semi-major axes are reasonable, considering the approximations we used.  The values we found for the masses are not accurate.  This is most likely due to error propagation, as we used the experimental values of the semi-major axes to calculate the masses.